Summary and Background
The ribosome exit tunnel is a sub-compartment of the ribosome whose geometry varies significantly across species, potentially affecting the translational dynamics and co-translational folding of nascent polypeptide1.
As the recent advances in imaging technologies result in a surge of high-resolution ribosome structures, we are now able to study the tunnel geometric heterogeneity comprehensively across three domains of life: bacteria, archaea and eukaryotes.
Here, we present some methods for large-scale analysis and comparison of tunnel structures.
Tunnel Shape
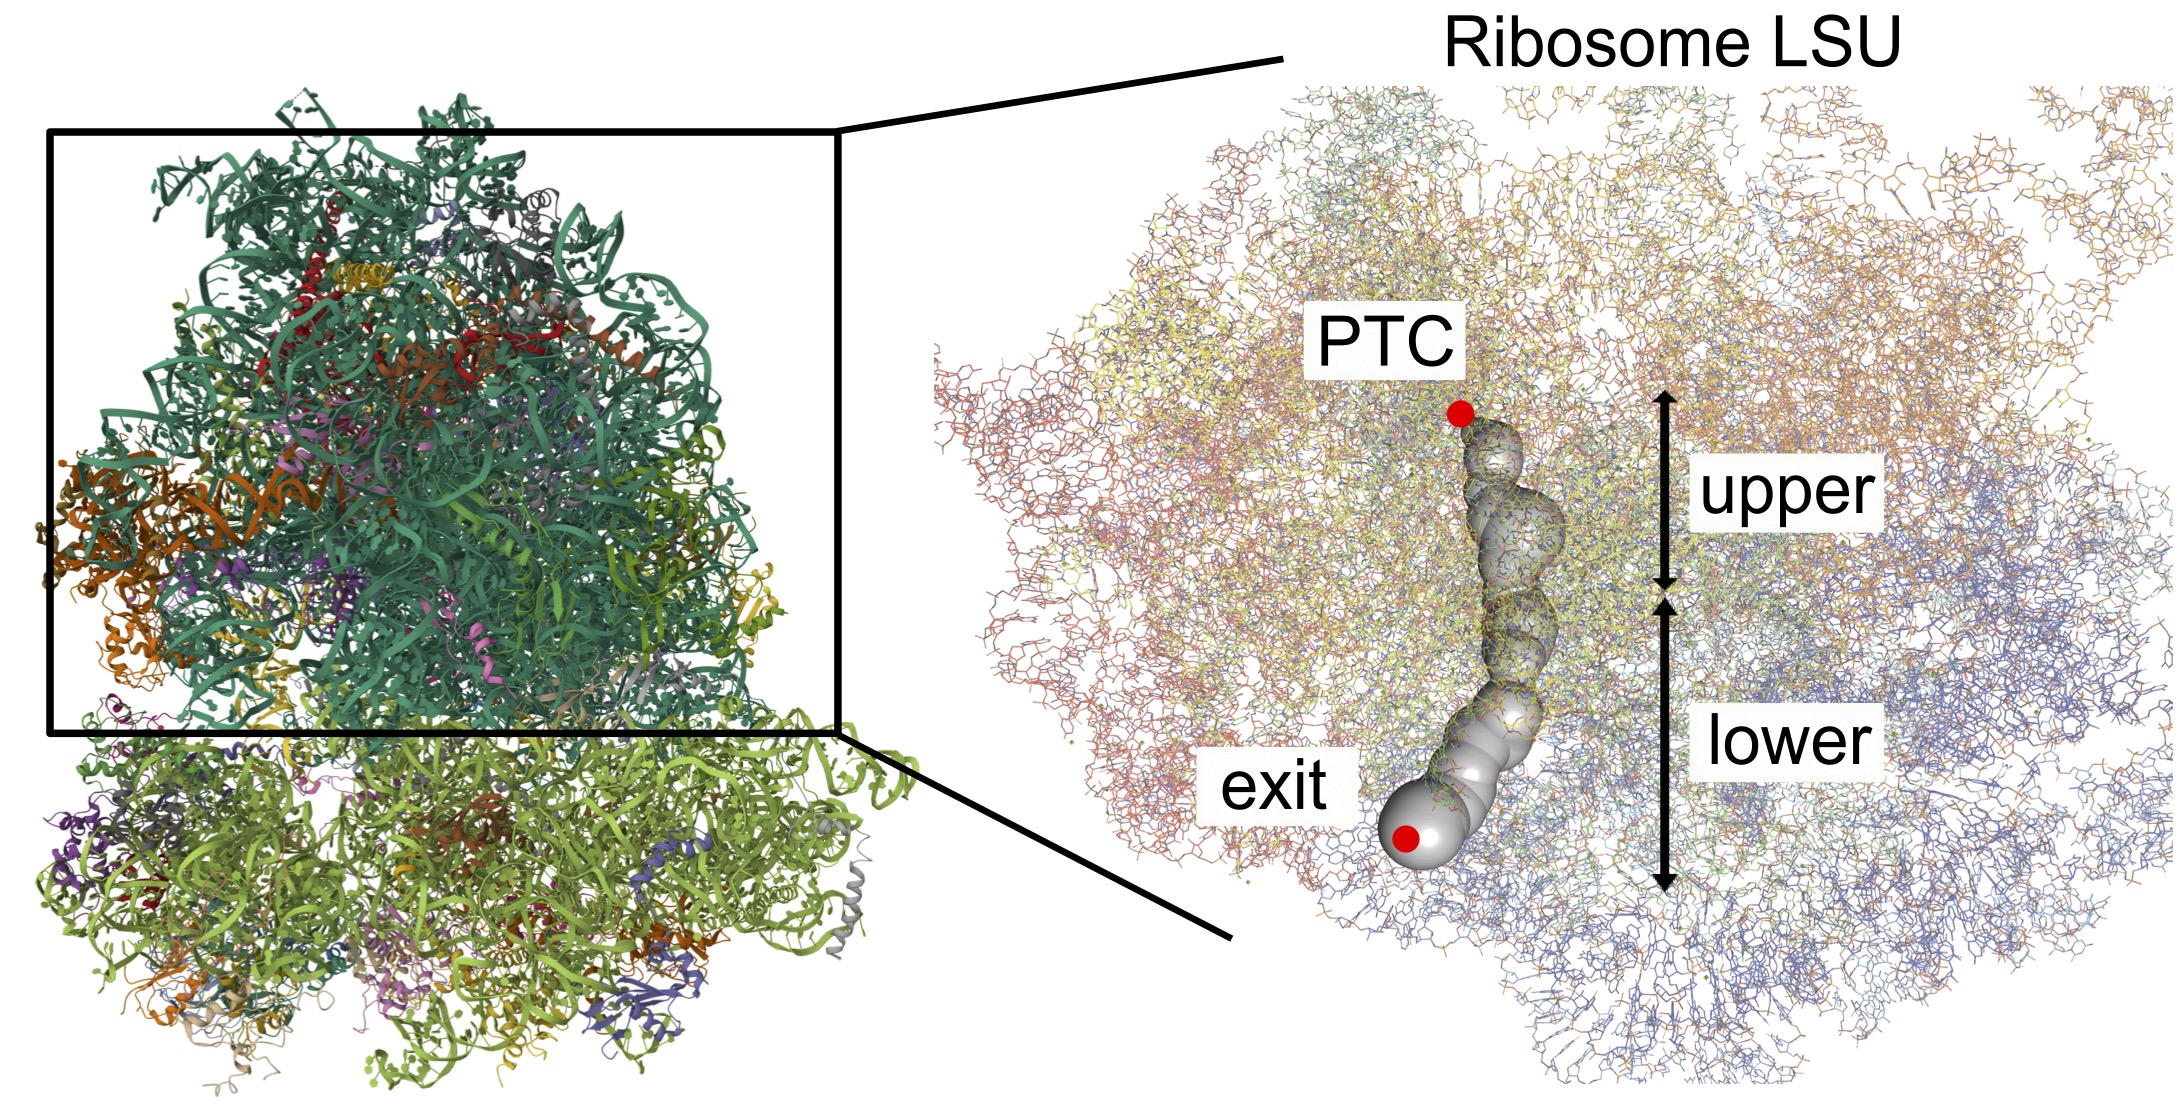
The ribosome exit tunnel spans from the peptidyl-transferase center (PTC), where amino acids are polymerized onto the growing nascent chain, to the surface of the ribosome.
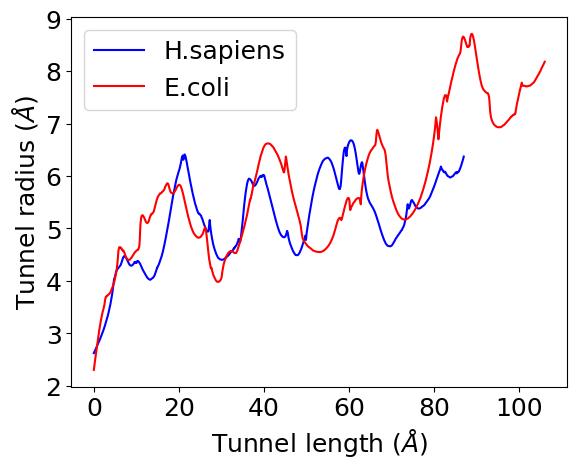
Typically, it measures 80-100 Å in length and 10-20 Å in diameter. While the eukaryotic tunnels are, on average, shorter and substantially narrower than prokaryote ones1.
In all domains of life, the tunnel features a universally conserved narrow region downstream of the PTC, so-called constriction site. However, the eukaryotic exit tunnel exhibit an additional (second) constriction site due to the modified structure of the surrounding ribosomal proteins.

Ribosome Dataset
Cryo-EM reconstructions and X-ray crystallography structures of ribosomes were retrived from the Protein Data Bank (https://www.rcsb.org) including 762 structures across 34 species domain.
The exit tunnels were extracted from the ribosomes using our developed tunnel-searching pipeline based on the MOLE cavity extraction algorithm developed by Sehnal et al.2.
Pairwise Distance
To simplify the geomertic comparisons, we first reduced the tunnel structure into a coordinate set that describes both the centerline trajectory and the tunnel radius at each centerline position,
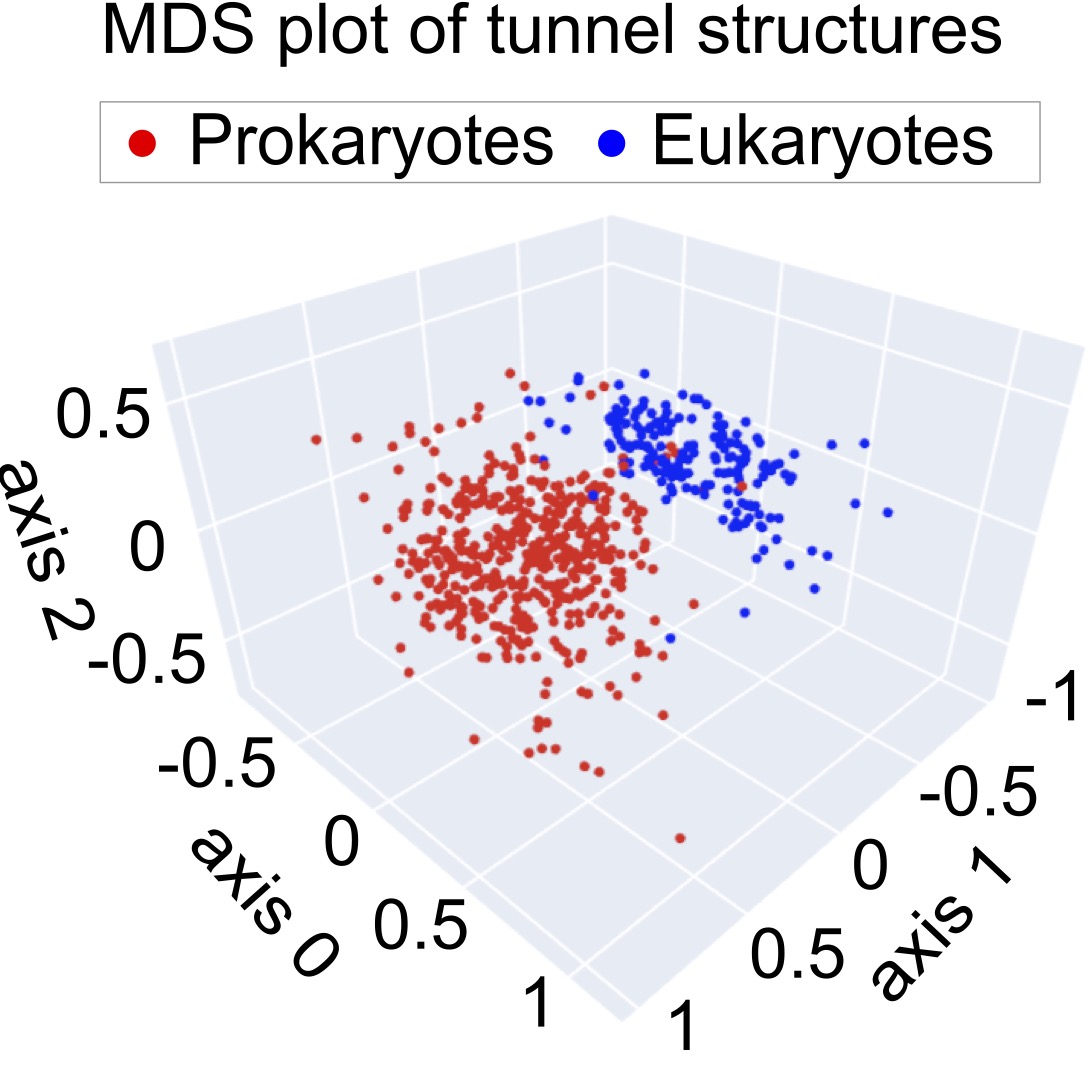
We then applied the pairwise distance metrics developed by Dao Duc et al.1 to compute the geometric similarity between tunnels. More details can be found in the previous work1.

MDS
The Multidimensional Scaling (MDS) method developed by Li et al.3 was applied on the pairwise distance matrix to visualize the geometric similarity of tunnels. Each data point represents a single tunnel structure, and the Euclidean distance between data points represents the similarity.
